
Analytics
Instagram Feed → Analytics
Answers the question merchants actually ask: is this gallery making money?
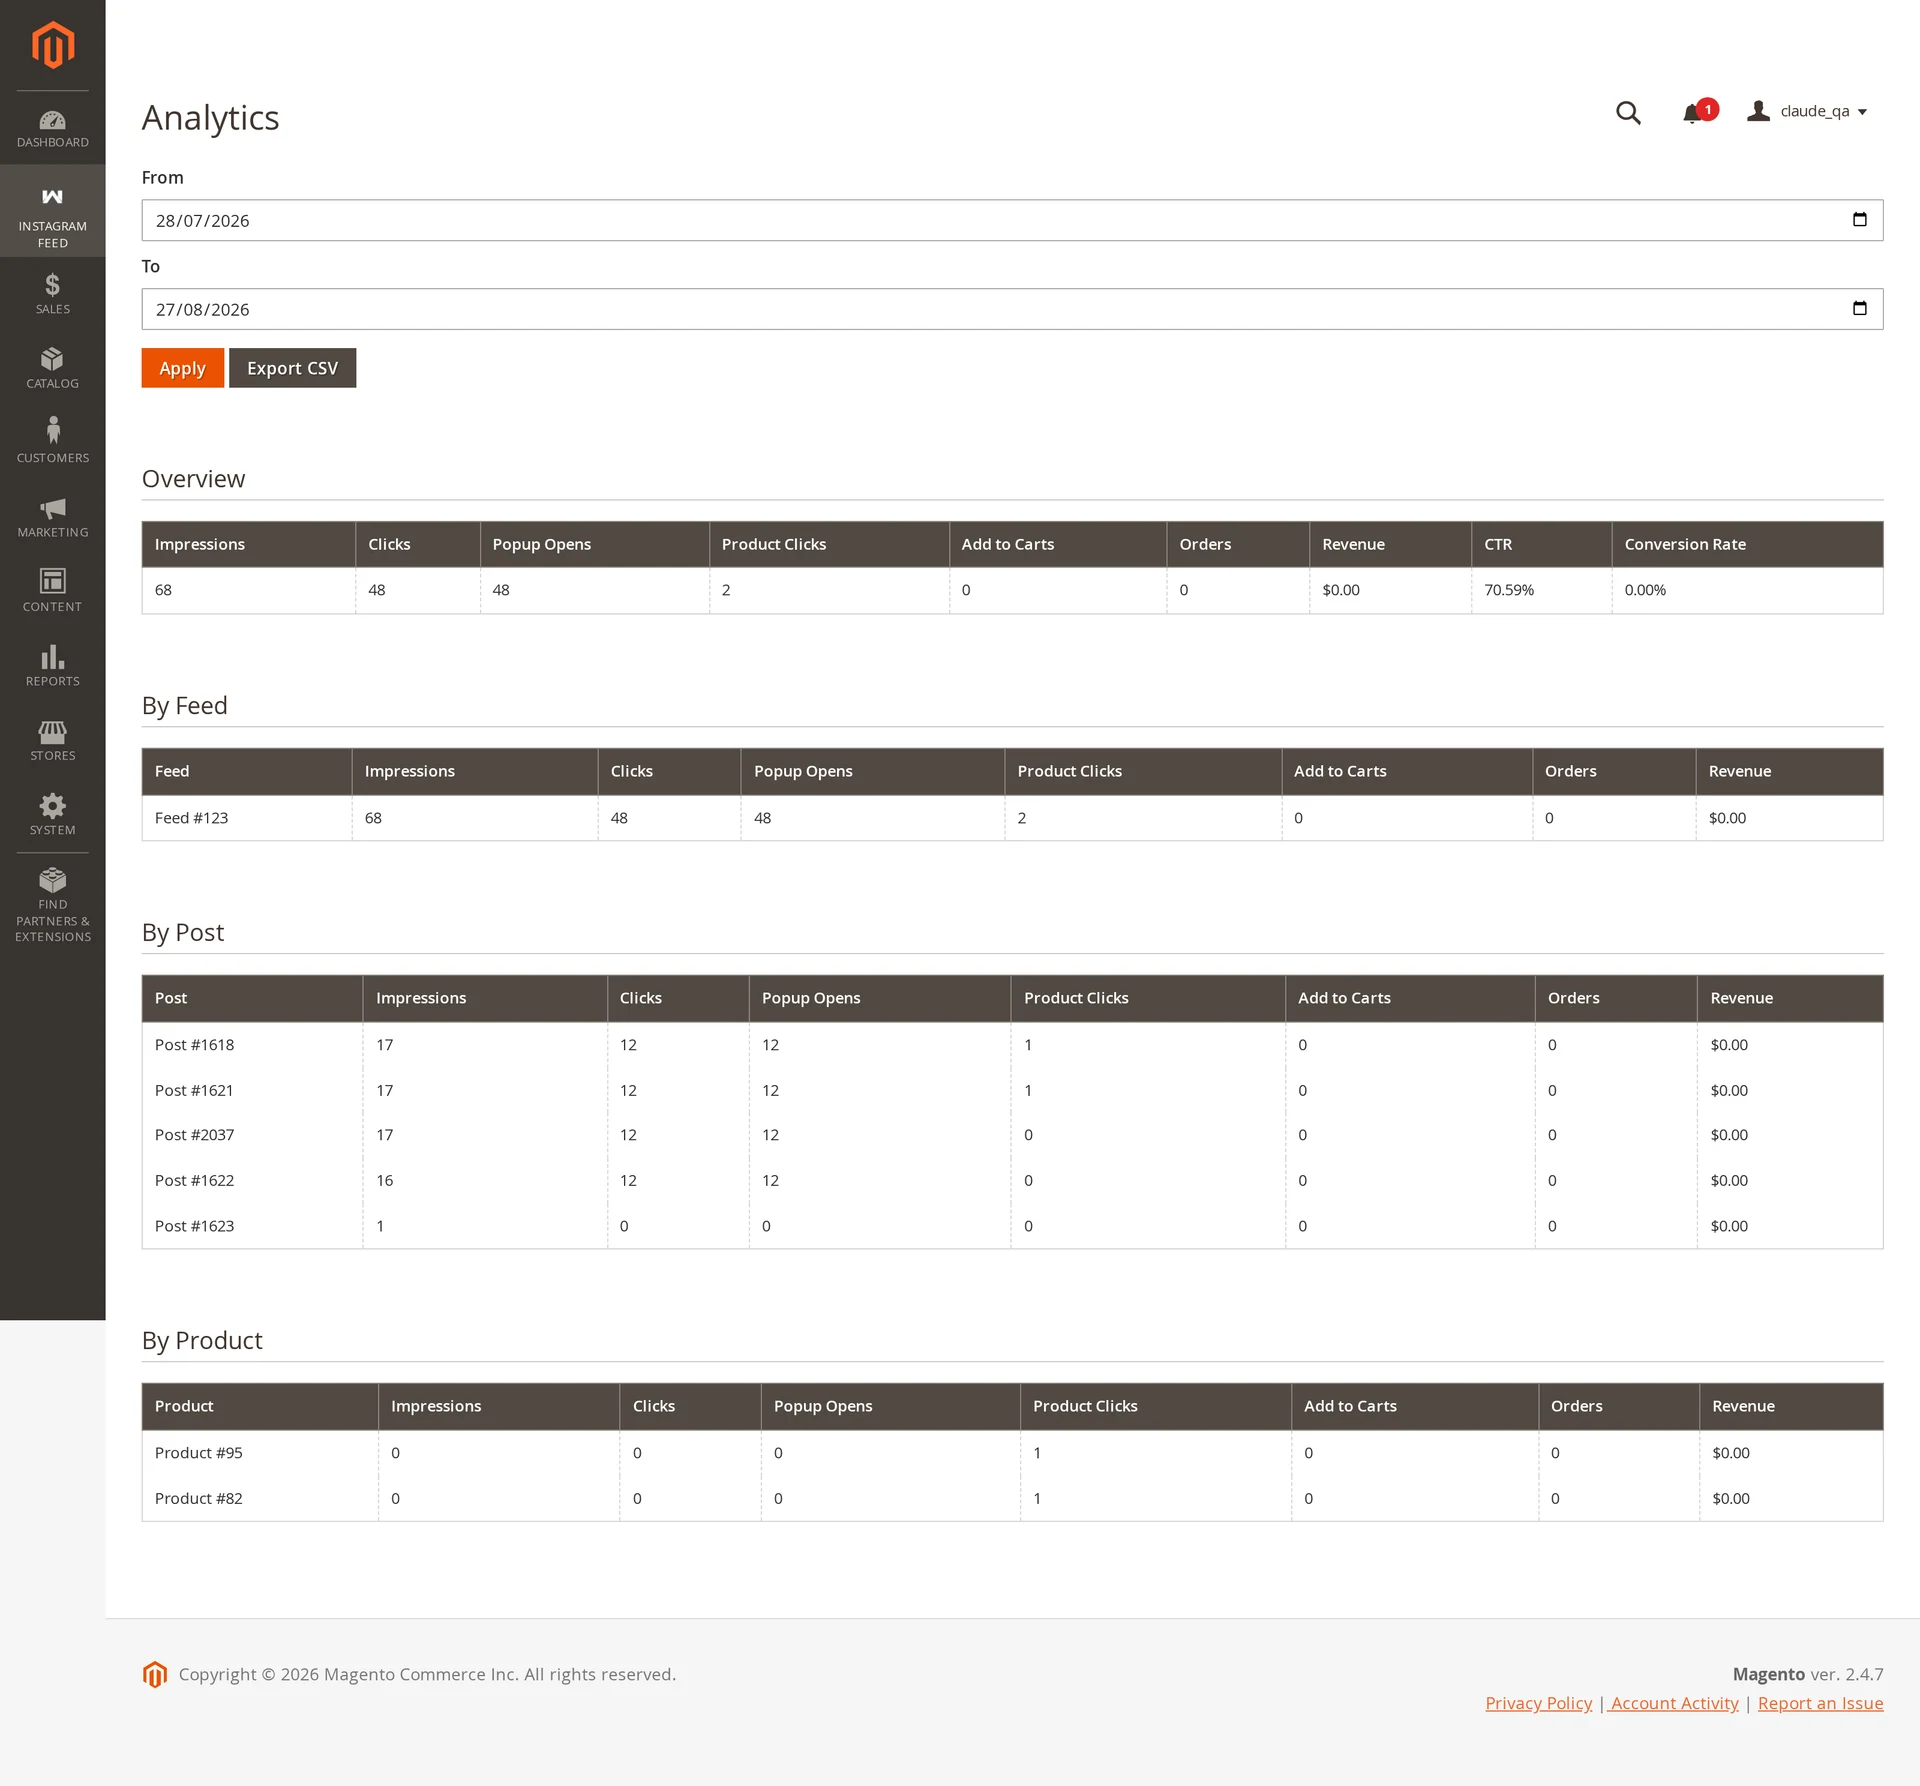
Metrics
| Metric | Counted when |
|---|---|
| Impressions | A tile scrolls into view |
| Clicks | A shopper clicks a tile |
| Popup Opens | The shoppable popup opens |
| Product Clicks | A product card is clicked |
| Add to Carts | A product is added from the popup |
| Orders | An order contains a product added from a feed |
| Revenue | Value of those orders |
| CTR | Clicks ÷ impressions |
| Conversion Rate | Orders ÷ clicks |
Break the same figures down by feed, by post and by product, over any date range.
How collection works
The storefront batches events and sends them in the background — on a timer, and again when the tab is hidden or closed, so a shopper who clicks and leaves still counts. Events go through a queue and are aggregated into daily rows per store, feed, post and product, which keeps reporting fast on large catalogs.
Treat the numbers as a trend
Figures appear once wkInstagramStatsIngest has processed the batch, and privacy extensions block some browsers from reporting at all. Every client-side analytics system undercounts; this one is no exception.
Nothing personal is collected: no shopper identifiers, no cookies of our own, no IP storage — only counters keyed by date, store, feed, post and product.
Export
Export CSV downloads the selected range: a summary block, then one section per breakdown. Cells starting with =, +, - or @ are quote-prefixed so opening the file in a spreadsheet cannot execute a formula.
See also
- Shoppable posts — what generates product clicks and add-to-carts
- Feed Sync & Cron — the consumer that aggregates these numbers