
RMA Analytics – Seller End
The marketplace seller can analyze return trends, track financial exposure from refunds, and identify problematic products directly from their vendor panel.
Navigate to RMA Analytics in the seller dashboard navigation menu.
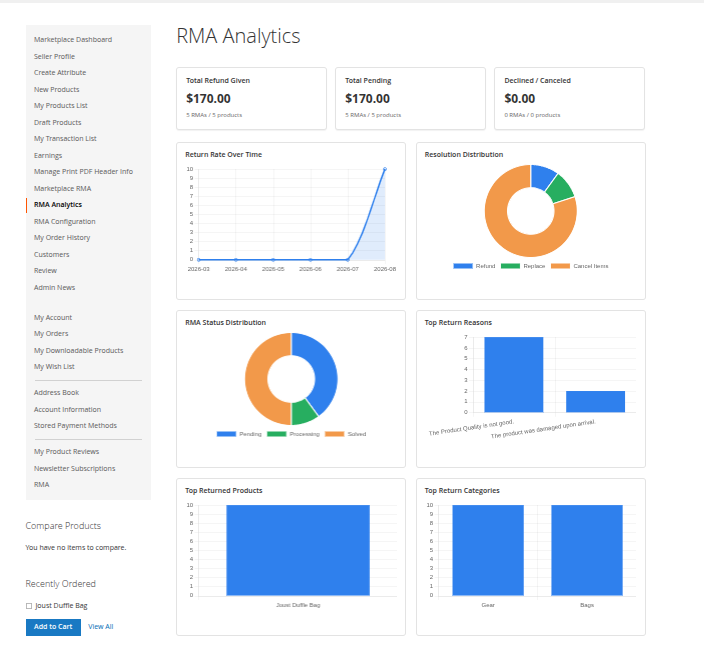
Hyva theme Seller RMA Analytics
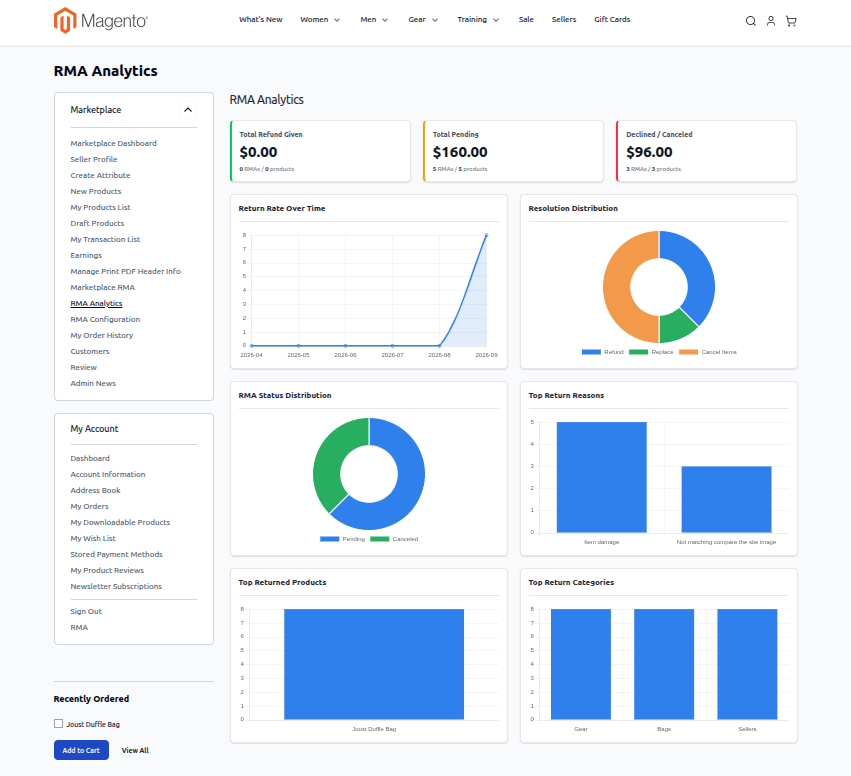
Seller KPI Metrics
The top stat cards summarize key financial and operational return metrics:
- Total Refund Given: Total monetary volume refunded to buyers alongside the total count of refunded products and RMA requests.
- Total Pending: Cumulative monetary value of items currently awaiting review, return package transit, or final resolution.
- Declined / Canceled: Total financial value and count of rejected, disqualified, or aborted return claims.
Visual Analytics & Charts
Interactive charts assist merchants in auditing return patterns and product quality:
- Return Rate Over Time: A longitudinal line chart depicting return volume day-by-day or month-by-month, highlighting seasonal post-holiday surges.
- Resolution Distribution: A circular pie chart displaying the relative proportions of Refund, Replace, and Cancel Items.
- RMA Status Distribution: Real-time breakdown of open tickets categorized by Pending, Processing, and Solved.
- Top Return Reasons: A horizontal bar chart identifying the most frequent return drivers (e.g., Sizing issues, Transit damage), helping sellers refine sizing charts or improve packaging.
- Top Returned Products: Highlights individual catalog SKUs with the highest return frequency, alerting sellers to possible manufacturing or batch flaws.
- Top Return Categories: Visualizes return distribution across catalog categories.